We have some columns in the lab that are for cleaning and concentrating genomic DNA. They are made by an outfit called Zymo Research and should be easy to find, look for a bright yellow box.
This post describes a test I ran of these columns.
Here is a link to the Zymo Research website product page for the columns in question.
Here is a downloadable pdf of the protocol.
I bought these columns when I thought I’d have to concentrate a lot of genomic DNA samples for WGS sequencing library preps. The company that makes the kit that I was using for library preps then changed the protocol such that I probably won’t need to concentrate many samples. Nevertheless, these columns might be handy for other purposes and I did try them out. So . . .
Cost
When I bought a 200 column kit in mid 2011 from Cedarlane it cost $481.50 including shipping. So, that’s $2.40 per column. Not too bad but you wouldn’t want to be using them unnecessarily.
What I did
- I took four sunflower genomic DNA samples from the batch of samples that Greg B. and I prepared for his GBS and my WGS sequencing projects in mid 2011 and made 1/50 dilutions of them with TE or water (can’t remember which). I did this so that I could start with dilute DNA – I’m testing the concentrating effect of the columns. Note that these samples were produced with the CTAB method that I have posted about previously and which usually gives high yields of good quality DNA.
- I quanted the 1/50 dilutions with the Nanodrop.
- I ran 200ul of the dilutions through the Zymo Research columns, as per the manufacturer’s instructions, eluting in 20ul of TE or water (can’t remember which).
- I did a second, separate, 20ul elution.
- I quanted the two elutions with the Nanodrop.
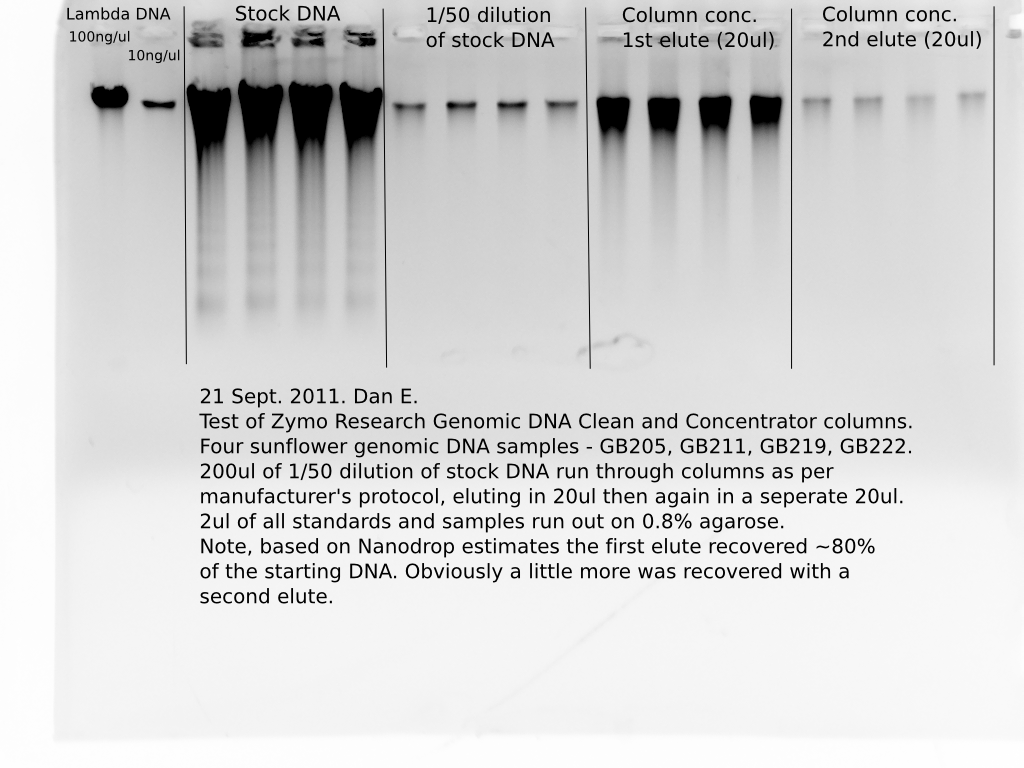
- I ran 2ul of the original samples, the 1/50 dilutions and the two elutions out on agarose alongside two lambda DNA concentration standards.
Results
Yield
| Sample | Stock conc. (ng/ul) | 1/50 conc. | ng DNA in 200ul | conc. in 20ul (100% recovery) | actual conc. 20ul elute 1 | % recovery |
| GB205 | 352 | 8 | 1600 | 80 | 56 | 70 |
| GB211 | 382 | 8 | 1600 | 80 | 64 | 80 |
| GB219 | 391 | 8.8 | 1760 | 88 | 64 | 73 |
| GB222 | 323 | 7.2 | 1440 | 72 | 52 | 72 |
The above table shows the results for yield or recovery of the starting DNA. I estimated the concentration of the starting 1/50 dilutions with the Nanodrop, then calculated the total ng of DNA in the 200ul of the dilutions that went in to the columns (1/50 dil. conc. * 200), then calculated the concentration of DNA one would expect in the first 20ul elute if all of the starting DNA was recovered (ng DNA in 200ul/20, or 10*starting conc given that the elution volume, 20ul, is 1/10th the starting volume, 200ul.). When you compare the expected concentration of the 20ul elute with the actual Nanodrop estimate of the concentration you can see that between 72 and 80 percent of the starting DNA was recovered in the first 20ul elute off the column. A very small additional amount of DNA was recovered by a second elute (see image below).
Note that if you were concentrating DNA samples to a particular concentration by tailoring the elution volume you would need to take the 20-30% DNA loss into account.
Quality
| Original 1/50 dilutions | 20ul elute 1 from ZR column | |||||
| Sample | 260/280 | 260/230 | ng/ul | 260/280 | 260/230 | ng/ul |
| GB205 | 1.73 | 3.99 | 8 | 1.77 | 20.34 | 56 |
| GB211 | 2.08 | 2.85 | 8 | 1.76 | 12.73 | 64 |
| GB219 | 1.47 | 2.75 | 8.8 | 1.76 | 10.8 | 64 |
| GB222 | 1.48 | 2.65 | 7.2 | 1.69 | 44.4 | 52 |
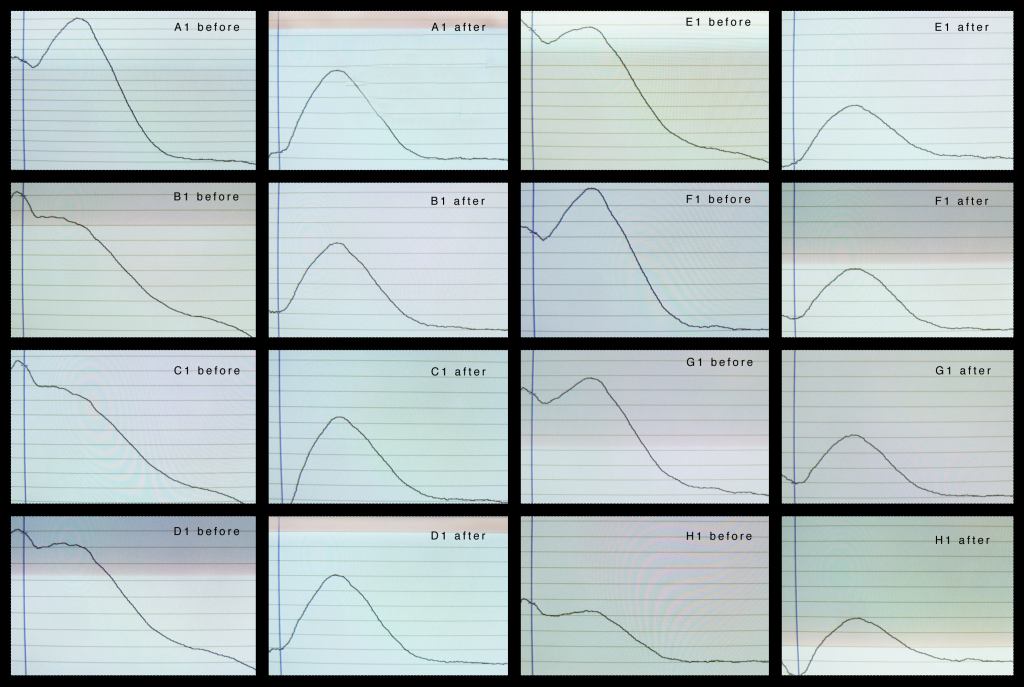
The table above shows the Nanodrop specs for the “before” and “after” samples. Note that the slightly crappy looking 260/280 specs for the 1/50 dilutions might be partially due to the low concentrations – I’ve noticed this effect on other occasions.
The thing to take away from this is the specs for the “cleaned and concentrated” samples, i.e. the elute off the ZR column, are good. The 260/280 ratios are good and the 260/230 ratios are off the chart. The reason for the very high 260/230 ratios is that there is virtually no absorbance at the lower wavelengths, ~230nm, in the cleaned sample. The graph the Nanodrop shows is spectacular in this regard – the left side of the absorbance trace is basically just missing. Unfortunately I haven’t saved any image to include here.
One thing the ZR columns are very clearly good at is stripping out whatever it is in DNA samples that absorbs at low wavelengths, ~230nm. This could be very important in some cases.
I also ran 2ul of each sample, “before” and “after” on an agarose gel:
In the image above you can see the concentration effect of the ZR columns and you can also see that the recovered DNA is high mw and does not appear to have been damaged/sheared by the column. I should have run a dilution of the “cleaned” DNA to see if it really is a nice tight high mw band – it probably is, there would probably be a similar effect to that you can see above when the raw DNA stocks were diluted.
Conclusion
There are other ways to concentrate DNA and there are other ways to try to “clean” DNA. The Zymo Research Genomic DNA Clean and Concentrator Columns do, however, appear to be a good way to both “clean” and concentrate genomic DNA provided you can afford to lose up to 30% of your starting DNA.
One appealing feature of the ZR column method is how quick and easy it is. It really only takes 5-15 mins depending on how many samples you are doing and its so easy that it would be hard to screw it up.
A characteristic of the ZR columns appears to be the removal of the contaminants that absorb at short wavelengths ~230nm. If you think that these contaminants are a problem for you then these columns might be just the ticket.
Note that my test was done with high quality DNA. It would be interesting to do it again with some genuinely poor or problematic DNA samples.
In many cases the loss of 30% of your starting DNA will be perfectly acceptable. I also suspect you could experiment with elution volume and, possibly, improve the recovery although obviously if you increase the elution volume too much you won’t achieve much in the way of concentration.
Note also, that my estimates of concentration, and therefore recovery rates, are based on Nanodrop estimates. Its possible that there is some difference in Nanodrop quantification between “uncleaned” and “cleaned” DNA such that my estimate of recovery rate is inaccurate. It might not be as bad as I’ve estimated it.
Also, if you really need to concentrate DNA without losing any of it, such that a column approach is not on the table, then you should investigate vacuum centrifugation. There is an Adam’s Lab vacuum centrifuge in the Biodiv. building.
Another thing to check out would be the kit that Zymo Research makes for removing enzyme inhibitors. I have a sample of this in the lab currently (Feb 2012) but haven’t tried it on anything. I wonder if its actually the same thing as the kit I’ve described above?
Dan E.
A follow-up test on poor quality DNA (Kate)
What I did
- I took eight H. petiolaris genomic DNA samples that I extracted using the Rieseberg lab 96-well DNA extraction kits (i.e. not Qiagen)
- I quanted the samples with the Cubit and Nanodrop.
- I ran 80ul of the stock DNA through the Zymo Research columns, as per the manufacturer’s instructions, eluting in 40ul of TE.
- I quanted the cleaned and concentrated samples with the Cubit and Nanodrop.
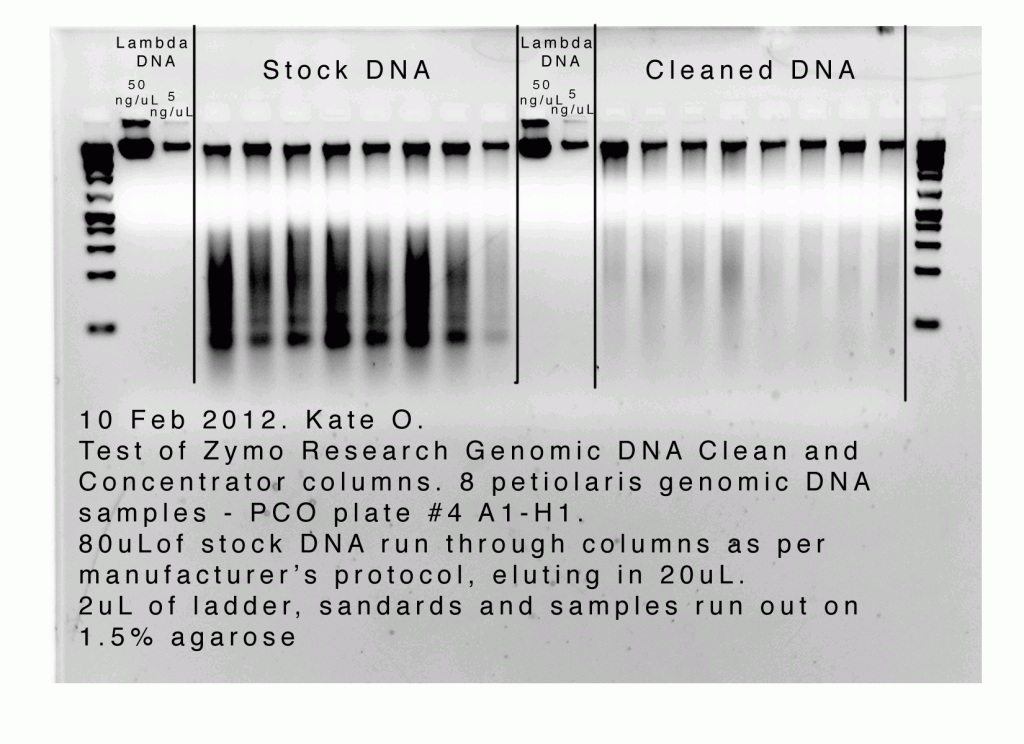
- I ran 2ul of the original samples and the cleaned and concentrated samples out on 1.5% agarose alongside two lambda DNA concentration standards and a ladder.
- Note: I am going to try PCR with the original and the cleaned and concentrated samples and add those results soon
Results
Yield
| Sample | Stock conc. (ng/ul) (Nanodrop) | Stock conc. (ng/ul) (Cubit) | Cleaned DNA conc. (ng/ul) (Nanodrop) | Cleaned DNA conc. (ng/ul) (Cubit) | ng lost (Cubit) | % recovery (Cubit) |
| A1 | 70 | 15 | 29 | 18 | 480 | 60 |
| B1 | 70 | 16 | 28 | 12 | 800 | 38 |
| C1 | 72 | 15 | 27 | 8 | 880 | 27 |
| D1 | 70 | 17 | 30 | 13 | 840 | 38 |
| E1 | 49 | 13 | 17 | 10 | 640 | 38 |
| F1 | 45 | 16 | 20 | 14 | 720 | 44 |
| G1 | 39 | 12 | 21 | 11 | 520 | 46 |
| H1 | 16 | 9 | 14 | 10 | 320 | 56 |
Quality
| Original samples | Cleaned and concentrated samples | |||||
| Sample | 260/280 | 260/230 | ng/uL | 260/280 | 260/230 | ng/ul |
| A1 | 1.97 | 1.42 | 70 | 1.77 | 16.07 | 29 |
| B1 | 1.60 | 0.78 | 70 | 1.77 | 5.15 | 28 |
| C1 | 1.57 | 0.77 | 72 | 1.71 | -4.59 | 27 |
| D1 | 1.64 | 0.89 | 70 | 1.84 | 6.62 | 30 |
| E1 | 1.70 | 1.02 | 49 | 1.64 | -13.5 | 17 |
| F1 | 1.91 | 1.44 | 45 | 1.59 | 4.85 | 20 |
| G1 | 1.83 | 1.15 | 39 | 1.81 | 4.37 | 21 |
| H1 | 2.08 | 0.87 | 16 | 1.65 | -2.67 | 14 |


I got a free sample of an RNA kit from the same company at PAG. It sounded very cool, but I’m not doing any extractions at the moment, so if any of you would like to try it you’re welcome to!
While we’re on the subject – we also have in the lab the gel extraction columns that Zymo Research makes. They are also in a bright yellow box. I’ve been using these columns to extract DNA from gel slices for the purposes of size selection. I’ll post about that separately.
I found that there can be splash back of guanidine solutions into the cap of columns. The splashed guanidine finds its way into the silica membrane. I get very clean purifications if I remember to do reaction cleanups with column caps removed. This may not be feasible with many reactions but if you’re doing <24 it may help you.
I just added a follow-up test that I did on poor quality DNA to the bottom of this post.
Great work Kate. It will be very interesting to see if the column treatment affects PCR.
One thing I want to note about your gel and your samples with regard to the DNA loss – it looks like you might have a lot of RNA in your DNA stocks (the bandy looking low mw stuff that is fluorescing) and that the columns remove almost all of that RNA. Was there an RNase step in the preparation of those samples?
RNA is one of the key “contiminants” that inflates the 260nm absorbance on the Nanodrop and thereby inflates your DNA concentration estimates. That said, you have very sensibly used the Qubit concentration estimates to estimate the amount of DNA you lost during the column treatment and I would expect the Qubit to be less prone to RNA contamination (Its supposed to be immune to it actually).
So, maybe the RNA thing doesn’t actually mean much in terms of the apparent loss of DNA. But, nevertheless its still of interest that the columns appear to remove RNA from DNA samples.
Nice addition to the post.
Dan E.