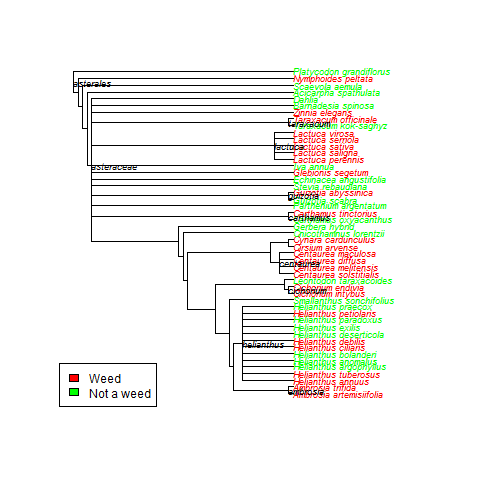
Basically, here is some easy code to search publicly available databases to determine a trait value for a species (in this case whether or not the species was recorded as invasive in any of 5 global invasive species databases), then make a quick tree based on published phylogenies using Phylomatic (http://phylodiversity.net/phylomatic/), then color code the tree based on the trait value.
Tag Archives: R
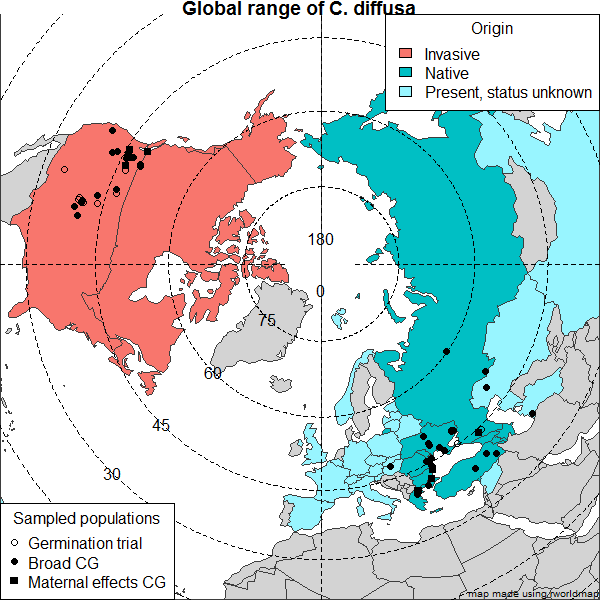
Modern map of Eurasia in R
Scripts for Formatting SNP Tables
Some SNP table to useful table conversion scripts are here: FormattingScripts_v0.4
Readme.txt explains usage, makes fasta, bayescan, structure files as well as converting to digits for R.
Let me know if you find any of this useful or broken.
Greg
Edit: updated small fix to structure formatter
CheapEasy DIY Barcodes in R
I couldn’t believe how expensive the software was for writing barcodes, so I wrote a short program in R to do it for FREE. And, frankly it should be faster and easier if you already have your labels in an Excel file. You don’t really need to understand the program or even R functions to use it, as long as you know how to run an R program.
Setup and Overview:
[UPDATED (see notes below)] – R-code. Start with this (Note I could not upload a .R file, so this is .txt but still an R program).
Input – barcodes128.csv – You need this file to run the program. Save it in your working directory (see comments in R code for how to set this). AND labels.csv – This is a sample file showing the format for your labels. Even though it’s a .csv, it is a single column with each label as a separate row, so there are no actual commas
Output – BarcodesOut.pdf – A sample output: a pdf file for the 0.5″x1.75″ Worth Poly Label WP0517 (Polyester Label Stock), currently in the lab
That’s really all you need to know, everything that follows is extraneous info. If you have any problems, check out the Detailed Instructions, Troubleshooting Tips, or add a comment below. Continue reading
SNP summary statistics in R: ‘hierfstat’ is back and better than before! (Rose)
After being disabled and not supported for several months, ‘hierfstat’ (by Jerome Goudet) now has lots of useful (and fast) calculations of summary statistics, including expected and observed heterozygosity, Fst and Jost’s Dest.
R script for plotting STRUCTURE results (Q values) (Rose)
This is an R Script that plots individual Q values and labels populations. It can be modified to take average group membership from CLUMPP output and/or to import different population names and higher level groupings from elsewhere.
N.B. I haven’t run this on very many data sets, so it will probably need to be tweaked for your results. But please leave a comment if you run into any problems.
Installing R packages and running scripts from the command line (Seb)
Installing R packages from the command line (on the cluster and/or on your own computer)
Note that in this post, lines preceded by the dollar sign ($) mean commands typed directly from your shell session. Lines preceded by the greaterthan sign (>), mean commands typed from an R session.
Continue reading


