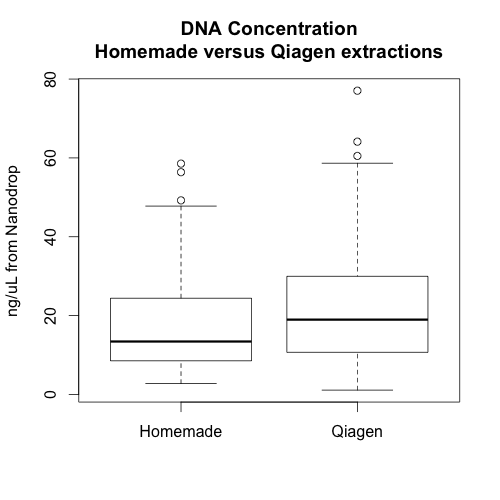
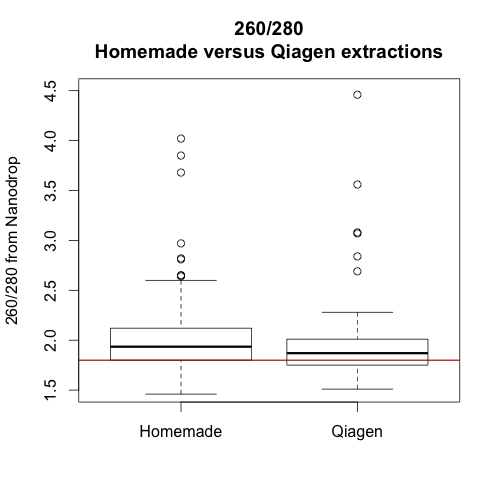
I had been having some trouble getting 96-well plate DNA extractions working consistently with our homemade regents, so Greg O and I decided to do a side by side comparison of our reagents with the Qiagen regents. Here are our results:
What we did:
- Collected tissue from 96 H. annuus x H. bolanderi F1s
- Put 2 size 5 punches (less than 50mg of tissue) into each of two 2mL tubes with two beads. The two tubes were placed in the same position in two racks (e.g. A1 Rieseberg plate and A1 Qiagen plate).
- Froze the tissue in liquid nitrogen.
- Ground the tissue in the 2mL eppendorfs for 4 bouts of 30 seconds (we cooled and reoriented the plates between each bout).
- Added the Qiagen extraction buffer to the Qiagen plate and buffer AP1 to the Riesebarg plate.
- Incubated the tubes at 65 degrees C for 10 minutes.
- Spun the tubes for 4 mins at 6000 rpm.
- Transfered 400uL of the supernatent to strip columns. (Note that steps 5-8 are much easier with 2 sets of hands)
- Followed the Qiagen 96-well plate protocol from step 14 using Qiagen reagents on the Qiagen plate and our homemade reagents on the other plate.
- Used the 8 channel nanodrop to measure DNA quality and quantity of both plates.
- Used the cubit to measure DNA quantity of the Qiagen plate only.

The three graphs on the left show the absorbance of 3 samples extracted with our homemade reagents. The three graphs on the right show the absorbance of 3 paired samples extracted with the Qiagen kit.
Additionally, there doesn’t appear to be any relationship between the amount of DNA extracted from a sample using our reagents and the amount of DNA extracted from the same sample using the Qiagen reagents. This may be because the nanodrop does not measure DNA quantity accurately when the samples are not clean or because the plant tissue doesn’t effect the extractions (the second option seems unlikely to me). It would be good to see a similar graph in which all the DNA concentrations were measured using the cubit, but we don’t have these data.
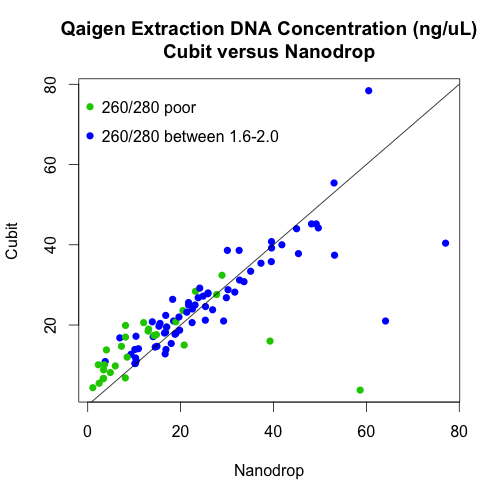
There is, however, a very strong relationship between the cubit and nanodrop measurements of DNA concentrations of the Qiagen extractions. In fact, the points follow the 1:1 line (the black line on the graph) quite well.
Finally, we also wanted to see if there are detectable patterns of DNA quality or quantity across the plates. The following images show the colour coded 260/280 and ng/uL values across the two plates. The top left corner of each image is position A1 (we worked through the plates from row A to row H during the extractions). There is no strong plate location effect on quality or quantity of the Qiagen extractions (great!). But, the homemade extraction quantity and quality may change through time, though this pattern is not strong.
In sum, it seems that the Qiagen extractions were better overall. They yielded slightly more high quality DNA and the extractions may be less sensitive to timing. Whether or not this improvement is worth the extra cost will depend on project specifics. However, hopefully, this information will help us avoid and/or troubleshoot poor DNA extractions in the future.
Best,
Kate


Quality post! Your nano-drop vs qubit looks quite a bit more 1:1 than I would have expected. I guess there is still the odd one that the nano-drop greatly over estimates.
Thanks for doing this, Kate and Greg O! This post is fantastic.