Author Archives: Charles Krebs

On Scientific Conferences

Should we ban scientific conferences and save the money for better science? What a terrible thought you would say if you were 25 years old, what a great idea you might say if you were 60 years old and have just come back from a conference with 9000 attendees and 30 concurrent sessions. So, there is no simple answer. Let us try to think of some rules of thumb if you are organizing a scientific conference. Since I am an ecologist I will talk largely about ecological meetings. There is already much interesting literature on this broad question (Zierath 2016, Blome et al. 2017, Hicke et al. 2017). For all I know conferences with 9000 registrants are ideal in neurobiology but in my opinion probably not useful in ecology.

Why have a conference? Simple, to transmit information among delegates. But you can do this more efficiently by reading current papers in the literature. So a conference is useful only if you get new insights that are not yet published, the cutting edge of science. Such insights are more likely to come from conferences that are spaced at 3-5 year intervals, a time frame in which some proper ecological research can be done. And insights are more likely to come from meetings that are narrow in scope to one’s immediate area of interest.

A second good reason for a conference is to meet people in your area of research. This is likely to be more successful if the meeting is small, perhaps a maximum of 150 attendees. This is the general approach of the Gordon Conferences. Meeting people is more difficult with larger conferences because, if there are multiple concurrent sessions, much time is spent moving among sessions and fewer people get the same view of scientific advances in an area. As one eminent ecologist pointed out to me, really important people do not go to any of the talks at conferences but rather socialize and conduct their own mini meetings near the coffee bar.

Organizing a conference is an exercise in utter frustration requiring the dictatorial behaviour of an army general. The general rule is the more talks the better, and never have a talk longer than 15 minutes lest someone get bored. In fact, speed talks are now the rage and you can have 3 minutes to tell the audience about what you are doing or have done. Perhaps if we are moving in this direction we should just have the conference via youtube so we could sit at home and see what parts of it we wanted to watch. If we add ‘tweets’ to conferences (Orizaola and Valdes 2015), we would certainly be following some of our world leaders for better or worse.

I have not been able to find anyone who would dare to calculate the financial cost of any conference and to try to construct a cost benefit ratio for a meeting. The argument would be that the costs can be calculated but the benefits are intangible, somewhat reminiscent of the arguments of our military leaders who demand more financial resources to achieve vague benefits. These concerns disappear if we consider a conference as a scientific tea party rather than an intellectual event. Perhaps we need a social science survey at the end of each conference with the attendees required to list the 5 major advances they obtained from the conference.

All these concerns convince me that we should restrict scientific conferences to small meetings on particular topics at relatively long intervals. Large conferences, should they seem desirable, should consist largely of longer plenary talks that synthesize the status of a specific area of ecology and provide a critique of current knowledge and suggestions of what to do next. These kinds of plenary talks are equivalent to synthesis papers in scientific journals, the kinds of papers that are all too rare in current journals.

One important consequence of scientific meetings can be to reach out to the public with evening lectures on topics of global concern (Hicke et al. 2017). Where it is feasible this recommendation can be an important way of extending information to the public on topics of concern like climate change or conservation management.

Whatever is decided by ecological societies about the structure of scientific conferences, some general rules about presentations ought to be written in large letters. If you are talking at a conservation ecology meeting, you should not spend half of your talk trying to convince the audience that there is a biodiversity crisis, or that climate change is happening. And for the details of a successful conference, read my earlier Blog (https://www.zoology.ubc.ca/~krebs/ecological_rants/how-to-run-a-successful-scientific-conference/) or Blome et al. (2017). This is not rocket science.

Blome, C., Sondermann, H., and Augustin, M. 2017. Accepted standards on how to give a Medical Research Presentation: a systematic review of expert opinion papers. GMS Journal for Medical Education 34(1): Doc11. doi: 10.3205/zma001088.

Hicke, J.A., Abatzoglou, J.T., Daley-Laursen, S., Esler, J., and Parker, L.E. 2017. Using scientific conferences to engage the public on climate change. Bulletin of the American Meteorological Society 98(2): 225-230. doi: 10.1175/BAMS-D-15-00304.1.

Orizaola, G., and Valdes, A.E. 2015. Free the tweet at scientific conferences. Science 350(6257): 170-171. doi: 10.1126/science.350.6257.170-c.

Zierath, J.R. 2016. Building bridges through scientific conferences. Cell 167(5): 1155-1158. doi: 10.1016/j.cell.2016.11.006.
On Post-hoc Ecology

Back in the Stone Age when science students took philosophy courses, a logic course was a common choice for students majoring in science. Among the many logical fallacies one of the most common was the Post Hoc Fallacy, or in full “Post hoc, ergo propter hoc”, “After this, therefore because of this.” The Post Hoc Fallacy has the following general form:

  1. A occurs before B.
  2. Therefore A is the cause of B.

Many examples of this fallacy are given in the newspapers every day. “I lost my pencil this morning and an earthquake occurred in California this afternoon.” Therefore….. Of course, we are certain that this sort of error could never occur in the 21st century, but I would like to suggest to the contrary that its frequency is probably on the rise in ecology and evolutionary biology, and the culprit (A) is most often climate change.

Hilborn and Stearns (1982) pointed out many years ago that most ecological and evolutionary changes have multiple causes, and thus we must learn to deal with multiple causation in which a variety of factors combine and interact to produce an observed outcome. This point of view places an immediate dichotomy between the two extremes of ecological thinking – single factor experiments to determine causation cleanly versus the “many factors are involved” world view. There are a variety of intermediate views of ecological causality between these two extremes, leading in part to the flow chart syndrome of boxes and arrows aptly described by my CSIRO colleague Kent Williams as “horrendograms”. If you are a natural resource manager you will prefer the simple end of the spectrum to answer the management question of ‘what can I possibly manipulate to change an undesirable outcome for this population or community?’

Many ecological changes are going on today in the world, populations are declining or increasing, species are disappearing, geographical distributions are moving toward the poles or to higher altitudes, and novel diseases are appearing in populations of plants and animals. The simplest explanation of all these changes is that climate change is the major cause because in every part of the Earth some aspect of winter or summer climate is changing. This might be correct, or it might be an example of the Post Hoc Fallacy. How can we determine which explanation is correct?

First, for any ecological change it is important to identify a mechanism of change. Climate, or more properly weather, is itself a complex factor of temperature, humidity, and rainfall, and for climate to be considered a proper cause you must advance some information on physiology or behaviour or genetics that would link some specific climate parameter to the changes observed. Information on possible mechanisms makes the potential explanation more feasible. A second step is to make some specific predictions that can be tested either by experiments or by further observational data. Berteaux et al. (2006) provided a careful list of suggestions on how to proceed in this manner, and Tavecchia et al. (2016) have illustrated how one traditional approach to studying the impact of climate change on population dynamics could lead to forecasting errors.

A second critical focus must be on long-term studies of the population or community of interest. In particular, 3-4 year studies common in Ph.D. theses must make the assumption that the results are a random sample of annual ecological changes. Often this is not the case and this can be recognized when longer term studies are completed or more easily if an experimental manipulation can be carried out on the mechanisms involved.

The retort to these complaints about ecological and evolutionary inference is that all investigated problems are complex and multifactorial, so that after much investigation one can conclude only that “many factors are involved”. The application of AIC analysis attempts to blunt this criticism by taking the approach that, given the data (the evidence), what hypothesis is best supported? Hobbs and Hilborn (2006) provide a guide to the different methods of inference that can improve on the standard statistical approach. The AIC approach has always carried with it the awareness of the possibility that the correct hypothesis is not present in the list being evaluated, or that some combination of relevant factors cannot be tested because the available data does not cover a wide enough range of variation. Burnham et al. (2011) provide an excellent checklist for the use of AIC measures to discriminate among hypotheses. Guthery et al. (2005) and Stephens et al. (2005) carry the discussion in interesting ways. Cade (2015) discusses an interesting case in which inappropriate AIC methods lead to questionable conclusions about habitat distribution preferences and use by sage-grouse in Colorado.

If there is a simple message in all this it is to think very carefully about what the problem is in any investigation, what the possible solutions or hypotheses are that could explain the problem, and then utilize the best statistical methods to answer that question. Older statistical methods are not necessarily bad, and newer statistical methods not automatically better for solving problems. The key lies in good data, relevant to the problem being investigated. And if you are a beginning investigator, read some of these papers.

Berteaux, D., et al. 2006. Constraints to projecting the effects of climate change on mammals. Climate Research 32(2): 151-158. doi: 10.3354/cr032151.

Burnham, K.P., Anderson, D.R., and Huyvaert, K.P. 2011. AIC model selection and multimodel inference in behavioral ecology: some background, observations, and comparisons. Behavioral Ecology and Sociobiology 65(1): 23-35. doi: 10.1007/s00265-010-1029-6.

Guthery, F.S., Brennan, L.A., Peterson, M.J., and Lusk, J.J. 2005. Information theory in wildlife science: Critique and viewpoint. Journal of Wildlife Management 69(2): 457-465. doi: 10.1890/04-0645.

Hilborn, R., and Stearns, S.C. 1982. On inference in ecology and evolutionary biology: the problem of multiple causes. Acta Biotheoretica 31: 145-164. doi: 10.1007/BF01857238

Hobbs, N.T., and Hilborn, R. 2006. Alternatives to statistical hypothesis testing in ecology: a guide to self teaching. Ecological Applications 16(1): 5-19. doi: 10.1890/04-0645

Stephens, P.A., Buskirk, S.W., Hayward, G.D., and Del Rio, C.M. 2005. Information theory and hypothesis testing: a call for pluralism. Journal of Applied Ecology 42(1): 4-12. doi: 10.1111/j.1365-2664.2005.01002.x

Tavecchia, G., et al. 2016. Climate-driven vital rates do not always mean climate-driven population. Global Change Biology 22(12): 3960-3966. doi: 10.1111/gcb.13330.

On Wildlife Management

There are two global views about wildlife management that are echoed in conservation biology. The first view is that we manage wildlife for the sake of wildlife so that future generations have the ability to see what we see when we go out into the woods and fields. The second view is that we manage wildlife and indeed all of nature for humans to exploit. The second view was elegantly summarized many years ago by White (1967):

Our science and technology have grown out of Christian attitudes toward man’s relation to nature which are almost universally held not only by Christians and neo-Christians but also by those who fondly regard themselves as post-Christians. Despite Copernicus, all the cosmos rotates around our little globe. Despite Darwin, we are not, in our hearts, part of the natural process. We are superior to nature, contemptuous of it, willing to use it for our slightest whim. The newly elected Governor of California, like myself a churchman but less troubled than I, spoke for the Christian tradition when he said (as is alleged), “when you’ve seen one redwood tree, you’ve seen them all.” (p.1206)

The first view of wildlife is now for ecologists the dominant conservation ethic of our time, the recognition that wildlife and nature in general has intrinsic value (Vucetich et al. 2015). Yet when there are conflicts in environmental management, the second view that humans trump all comes to the fore. Think of examples in your region. When caribou and moose are declining, the shout goes up to shoot the wolves. The golden example of this is perhaps Norway where wolves are nearly all gone and moose are superabundant and fed in winter so that there are plenty for hunters to shoot in the following year. Where domestic and feral cats threaten bird populations, the view typically expressed is that cats are our pets and quite cute, and certainly cannot be regulated or controlled as feral pests.

One of the main defenses of biodiversity conservation during the last 20 years has been the role of ecosystem services. The utilitarian view that ecosystems do things for humans that you can then calculate in dollars has been used to carry conservation forward for those who subscribe to the second global view of nature as something that exists only for our exploitation. Two recent reviews are critical of this approach. Silvertown (2015) argues that the ecosystem services paradigm has been oversold and suggests alternatives. An important critical overview of the conundrum of biodiversity research is presented very clearly in Vellend (2017) and is essential reading for all those interested in environmental management issues and the collision of science and human values expressed in our two global views of biodiversity conservation.

Wildlife managers must operate with the first view in mind to manage wildlife for wildlife but at the same time must act in ways determined by their political masters to adopt the second view of human values over wildlife. Ecologists walk a thin line in this dilemma. A good example is the book by Woinarski et al. (2007) which details the disastrous state of environmental management in northern Australia. There are courageous attempts to resolve these management problems and to bridge the two global views by bringing ecological knowledge into policy development and environmental management (e.g. Morton et al. 2009, Lindenmayer et al. 2015). Many others beginning with Aldo Leopold in North America and many others in Europe have made elegant pleas for the first global view of wildlife conservation. The attempts now to bridge this gap between exploitation and preservation are to bring social sciences into environmental research programs, and these efforts can be increasingly effective. But there is a large contingent of the public that support the second view that humans are the most important species on earth. The increasing collision of rising human populations, resource shortages, and climate change produce a perfect storm of events that place wildlife management and environmental sustainability in a difficult position. Everyone who is able must speak up for the first global view in order to achieve a sustainable society on earth and for wildlife and biodiversity in general to be protected for future generations.

Lindenmayer, D.B.,et al. 2015. Contemplating the future: Acting now on long-term monitoring to answer 2050’s questions. Austral Ecology 40(3): 213-224. doi: 10.1111/aec.12207.

Morton, S.R., et al. 2009. The big ecological questions inhibiting effective environmental management in Australia. Austral Ecology 34(1): 1-9. doi: 10.1111/j.1442-9993.2008.01938.x.

Silvertown, J. 2015. Have Ecosystem Services been oversold? Trends in Ecology & Evolution 30(11): 641-648. doi: 10.1016/j.tree.2015.08.007.

Vellend, M. 2017. The biodiversity conservation paradox. American Scientist 105(2): 94-101.

Vucetich, J.A., Bruskotter, J.T., and Nelson, M.P. 2015. Evaluating whether nature’s intrinsic value is an axiom of or anathema to conservation. Conservation Biology 29(2): 321-332. doi: 10.1111/cobi.12464.

White, L., Jr. 1967. The historical roots of our ecologic crisis. Science 155(3767): 1203-1207.

Woinarski, J., Mackey, B., Nix, H., and Traill, B. 2007. The Nature of Northern Australia: Natural values, ecological processes and future prospects. Australian National University E Press, Canberra. (available at: http://press.anu.edu.au/publications/nature-northern-australia)

On Biodiversity and Ecosystem Function

I begin with a quote from Seddon et al. (2016):

By 2012, the consensus view based on 20 years of research was that (i) experimental reduction in species richness, at any trophic level, negatively impacts both the magnitude and stability of ecosystem functioning [12,52], and (ii) the impact of biodiversity loss on ecosystem functioning is comparable in magnitude to other major drivers of global change [13,54].”

The references are to Cardinale et al. (2012), Naeem et al. (2012), Hooper et al. (2012), and Tilman et al. (2012).

The basic conclusion of the literature cited here is that with very extensive biodiversity loss, ecosystem function such as primary productivity will be reduced. I first of all wonder which set of ecologists would doubt this. Secondly, I would like to see these papers analysed for problems of data analysis and interpretation. A good project for a graduate class in experimental design and analysis. Many of the studies I suspect are so artificial in design as to be useless for telling us what will really happen as natural biodiversity is lost. At best perhaps we can view them as political ecology to try to convince politicians and the public to do something about the true drivers of the mess, climate change and overpopulation.

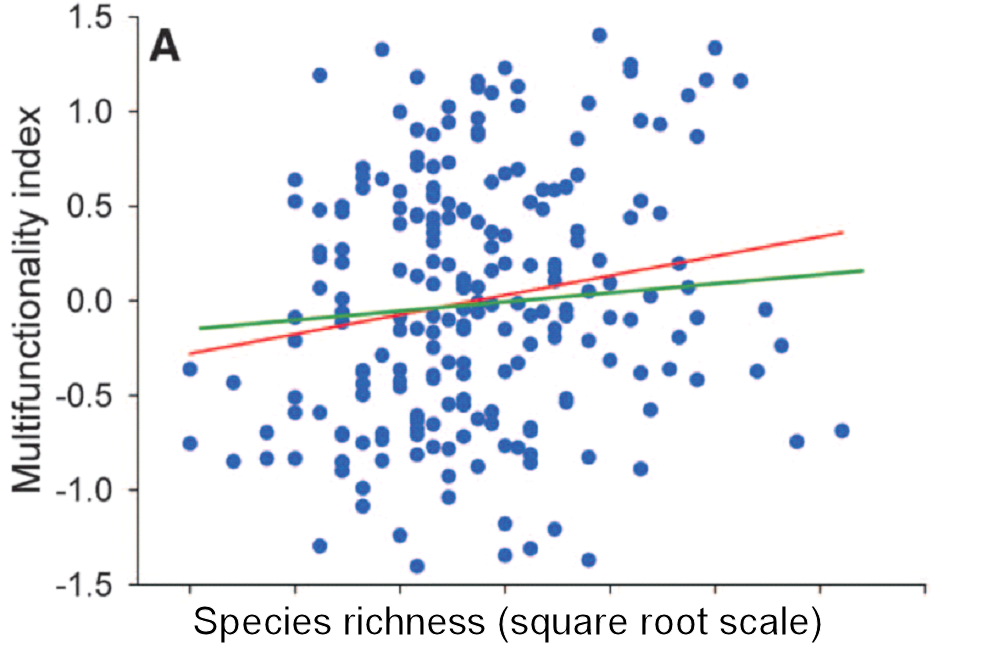
Too many of the graphs I see in published papers on biodiversity and ecosystem function look like this (from Maestre et al. (2012): data from 224 global dryland plots)

There is a trend in these data but zero predictability. And even if you feel that showing trends are good enough in ecology, the trend is very weak.

Many of these analyses utilize meta-analysis. I am a critic of the philosophy of meta-analysis and not alone in wondering how useful many of these are in guiding ecological research (Vetter et al. 2013, Koricheva, and Gurevitch 2014). Perhaps the strongest division in deciding the utility of these meta-analyses is whether one is interested in general trends across ecosystems or predictability which depends largely on understanding the mechanisms behind particular trends.

Another interesting aspect of many of these analyses lies in the preoccupation with stability as a critical ecosystem function maintained by species richness. In contrast to this belief, Jacquet et al. (2016) have argued that in empirical food webs there is no simple relationship between species richness and stability, contrary to conventional theory.

Finally, another quotation from Naeem et al. (2012) which raises a critical issue on which ecologists need to focus more:

“In much of experimental ecological research, nature is seen as the complex, species-rich reference against which treatment effects are measured. In contrast, biodiversity and ecosystem functioning experiments often simply compare replicate ecosystems that differ in biodiversity, without any replicate serving as a reference to nature. Consequently, it has often been difficult to evaluate the external validity of biodiversity and ecosystem functioning research, or how its findings map onto the “real” worlds of conservation and decision making. Put another way, what light can be shed on the stewardship of nature by microbial microcosms that have no analogs in nature, or by experimental grassland studies in which some plots have, by design, no grass species? “ (page 1403)

And for those of you who are animal ecologists, the vast bulk of these studies were done on plants with none of the vertebrate browsers and grazers present. Perhaps some problems here.

Whatever one’s view of these research paradigms, no questions will be answered if we lose too much biodiversity.

Cardinale, B.J., Duffy, J.E., Gonzalez, A., Hooper, D.U., Perrings, C., Venail, P., Narwani, A., Mace, G.M., Tilman, D., Wardle, D.A., Kinzig, A.P., Daily, G.C., Loreau, M., Grace, J.B., Larigauderie, A., Srivastava, D.S. & Naeem, S. (2012) Biodiversity loss and its impact on humanity. Nature, 486, 59-67. doi: 10.1038/nature11148

Hooper, D.U., Adair, E.C., Cardinale, B.J., Byrnes, J.E.K., Hungate, B.A., Matulich, K.L., Gonzalez, A., Duffy, J.E., Gamfeldt, L. & O/’Connor, M.I. (2012) A global synthesis reveals biodiversity loss as a major driver of ecosystem change. Nature, 486, 105-108. doi: 10.1038/nature11118

Jacquet, C., Moritz, C., Morissette, L., Legagneux, P., Massol, F., Archambault, P. & Gravel, D. (2016) No complexity–stability relationship in empirical ecosystems. Nature Communications, 7, 12573. doi: 10.1038/ncomms12573

Koricheva, J. & Gurevitch, J. (2014) Uses and misuses of meta-analysis in plant ecology. Journal of Ecology, 102, 828-844. doi: 10.1111/1365-2745.12224

Maestre, F.T. et al. (2012) Plant species richness and ecosystem multifunctionality in global drylands. Science, 335, 214-218. doi: 10.1126/science.1215442

Naeem, S., Duffy, J.E. & Zavaleta, E. (2012) The functions of biological diversity in an Age of Extinction. Science, 336, 1401.

Seddon, N., Mace, G.M., Naeem, S., Tobias, J.A., Pigot, A.L., Cavanagh, R., Mouillot, D., Vause, J. & Walpole, M. (2016) Biodiversity in the Anthropocene: prospects and policy. Proceedings of the Royal Society B: Biological Sciences, 283, 20162094. doi: 10.1098/rspb.2016.2094

Tilman, D., Reich, P.B. & Isbell, F. (2012) Biodiversity impacts ecosystem productivity as much as resources, disturbance, or herbivory. Proceedings of the National Academy of Sciences 109, 10394-10397. doi: 10.1073/pnas.1208240109

Vetter, D., Rücker, G. & Storch, I. (2013) Meta-analysis: A need for well-defined usage in ecology and conservation biology. Ecosphere, 4, art74. doi: 10.1890/ES13-00062.1

On Ecological Predictions

The gold standard of ecological studies is the understanding of a particular ecological issue or system and the ability to predict the operation of that system in the future. A simple example is the masting of trees (Pearse et al. 2016). Mast seeding is synchronous and highly variable seed production among years by a population of perennial plants. One ecological question is what environmental drivers cause these masting years and what factors can be used to predict mast years. Weather cues and plant resource states presumably interact to determine mast years. The question I wish to raise here, given this widely observed natural history event, is how good our predictive models can be on a spatial and temporal scale.

On a spatial scale masting events can be widespread or localized, and this provides some cues to the important weather variables that might be important. Assuming we can derive weather models for prediction, we face two often unknown constraints – space and time. If we can derive a weather model for trees in New Zealand, will it also apply to trees in Australia or California? Or on a more constrained geographical view, if it applied on the South Island of New Zealand will it also apply on the North Island? At the other extreme, must we derive models for every population of particular plants in different areas, so that predictability is spatially limited? We hope not and work on the assumption of more spatial generality than what we can measure on our particular small study areas.

The temporal stability of our explanations is now particularly worrisome because of climate change. If we have a good model of masting for a particular tree species in 2017, will it still be working in 2030, 2050 or 2100? A physicist would never ask such a question since a “scientific law” is independent of time. But biology in general and ecology in particular is not time independent both because of evolution and now in particular because of changing climate. But we have not faced up to whether or not we must check our “ecological laws” over and over again as the environment changes, and if we have to do this what must the time scale of rechecking be? Perhaps this question can be answered by determining the speed of potential evolutionary change in species groups. If virus diseases can evolve quickly in terms of months or years, we must be eternally vigilant to consider if the flu virus of 2017 is going to be the same as that of 2016. We should not stop virus research and say that we have sorted out some universal model that will become an equivalent of the laws of physics.

The consequences of these simple observations are not simple. One consequence is the implication that monitoring is an essential ecological activity. But in most ecological funding agencies monitoring is thought to be unscientific, not leading to progress, and more stamp collecting. So we have to establish that, like the Weather Bureau every country supports, we must have an equivalent ecological monitoring bureau. We do have these bureaus for some ecological systems that make money, like marine fisheries, but most other ecosystems are left in limbo with little or no funding on the generalized assumption that “mother or father nature will take care of itself” or expressed more elegantly by a cabinet minister who must be nameless, “there is no need for more forestry research, as we know everything we need to know already”. The urge by politicians to cut research funding lives too much in environmental research.

But ecologists are not just ‘stamp collectors’ as some might think. We need to develop generality but at a time scale and a spatial scale that is reliable and useful for the resolution of the problem that gave rise to the research. Typically for ecological issues this time scale would be 10-25 years, and a rule of thumb might be for 10 generations of the organisms being studied. For many of our questions an annual scale might be most useful, but for long-lived plants and animals we must be thinking of decades or even centuries. Some practical examples from Pacifici et al. (2013): If you study field voles (Microtus spp.) typically you can complete your studies of 10 generations in 3.5 years (on average). If you study red squirrels (Tamiasciurus hudsonicus), the same 10 generations will cost you 39 years, and if red foxes (Vulpes vulpes) 58 years. If wildebeest (Connochaetes taurinus) in the Serengeti, 10 generations will take you 80 years, and if you prefer red kangaroos (Macropus rufus) it will take about 90 years. All these estimates are very approximate but they give you an idea of what the time scale of a long-term study might be. Except for the rodent example, all these study durations are nearly impossible to achieve, and the question for ecologists is this: Should we be concerned about these time scales, or should we scale everything to the human research time scale?

The spatial scale has expanded greatly for ecologists with the advent of radio transmitters and the possibility of satellite tracking. These technological advances allow many conservation questions regarding bird migration to be investigated (e.g. Oppel et al. 2015). But no matter what the spatial scale of interest in a research or management program, variation among individuals and sites must be analyzed by means of the replication of measurements or manipulations at several sites. The spatial scale is dictated by the question under investigation, and the issue of fragmentation has focused attention on the importance of spatial movements both for ecological and evolutionary questions (Betts et al. 2014).

And the major question remains: can we construct an adequate theory of ecology from a series of short-term, small area or small container studies?

Betts, M.G., Fahrig, L., Hadley, A.S., Halstead, K.E., Bowman, J., Robinson, W.D., Wiens, J.A. & Lindenmayer, D.B. (2014) A species-centered approach for uncovering generalities in organism responses to habitat loss and fragmentation. Ecography, 37, 517-527. doi: 10.1111/ecog.00740

Oppel, S., Dobrev, V., Arkumarev, V., Saravia, V., Bounas, A., Kret, E., Velevski, M., Stoychev, S. & Nikolov, S.C. (2015) High juvenile mortality during migration in a declining population of a long-distance migratory raptor. Ibis, 157, 545-557. doi: 10.1111/ibi.12258

Pacifici, M., Santini, L., Di Marco, M., Baisero, D., Francucci, L., Grottolo Marasini, G., Visconti, P. & Rondinini, C. (2013) Database on generation length of mammals. Nature Conservation, 5, 87-94. doi: 10.3897/natureconservation.5.5734

Pearse, I.S., Koenig, W.D. & Kelly, D. (2016) Mechanisms of mast seeding: resources, weather, cues, and selection. New Phytologist, 212 (3), 546-562. doi: 10.1111/nph.14114

Ecological Alternative Facts

It has become necessary to revise my recent ecological thinking about the principles of ecology along the lines now required in the New World Order. I list here the thirteen cardinal principles of the new ecology 2017:

  1. Population growth is unlimited and is no longer subject to regulation.
  2. Communities undergo succession to the final equilibrium state of the 1%.
  3. Communities and ecosystems are resilient to any and all disturbances and operate best when challenged most strongly, for example with oil spills.
  4. Resources are never limiting under any conditions for the 1% and heavy exploitation helps them to trickle down readily to assist the other 99%.
  5. Overexploiting populations is good for the global ecosystem because it gets rid of the species that are wimps.
  6. Mixing of faunas and floras have been shown over the last 300 years to contribute to the increasing ecological health of Earth.
  7. Recycling is unnecessary in view of recent advances in mining technology.
  8. Carbon dioxide is a valuable resource for plants and we must increase its contribution to atmospheric chemistry.
  9. Climate change is common and advantageous since it occurs from night to day, and has always been with us for many millions of years.
  10. Evolution maximizes wisdom and foresight, especially in mammals.
  11. Conservation of less fit species is an affront to alternative natural laws that were recognized during the 18th century and are now mathematically defined in the new synthetic theory of economic and ecological fitness.
  12. Scientific experiments are no longer necessary because we have computers and technological superiority.
  13. Truth in science is no longer necessary and must be balanced against equally valid post-truth beliefs.

The old ecology, now superseded, was illustrated in Krebs (2016), and is already out of date. Recommendations for other alternative ecological facts will be welcome. Please use the comments.

Krebs, C.J. (2016) Why Ecology Matters. University of Chicago Press, Chicago. 208 pp.

On Conservation

The question of how ecology can guide decisions about conservation actions is a vexed one of which much has already been written with respect to conservation triage (Bottrill et al. 2009, Gerber 2016). The global question – what should we do now? – produces two extreme answers: (1) do nothing. The biodiversity on earth has gone through many climatic fluctuations imposed by geology and planetary physics and these forces are out of our hands. Or (2) we must protect all species because we do not know if they are important for ecosystem function. The government recognizes that (2) is impossible, and either reflects back to answer (1) or politely asks scientists to suggest what is possible to achieve with limited funding. John Wiens (2016) in an interesting discussion in the British Ecological Society Bulletin (December 2016, pp 38-39) suggests that two possible solutions to this conundrum are to get more funding for conservation to reduce this clear financial limitation, or secondly to move from the conservation of individual species to that of ecosystems. The problem he and many others recognize is that the public at large fall in love with individual species much more readily than with ecosystems. It is the same problem medical science often faces with contributions from wealthy people – attack individual diseases with my funding, not public health in general.

Ecologists face this dilemma with respect to their research agenda and research grants in general – what exactly can you achieve in 3-5 years with a small amount of money? If your research is species-specific, something useful can often be studied particularly if the threatening processes are partly understood and you adopt an experimental approach. If your research is ecosystem oriented and your funds are limited you must generally go to the computer and satellite ecology to make any short term research possible. This problem of larger scale = larger costs can be alleviated if you work in a group of scientists all addressing the same ecosystem issue. This still requires large scale funding which is not as easily obtained as ecologists might like. The government by contrast wishes more and more to see results even after only a few years, and asks whether you have answered your original question. The result is a patchwork of ecological data which too often makes no one happy.

If you want a concrete example, consider the woodland caribou of western Canada (Schneider et al. 2010). For these caribou Hebblewhite (2017) has clearly outlined a case in which the outcomes of any particular action are difficult to predict with the certainty that governments and business would be happy with. Many small herds are decreasing in size, and one path is to triage them, leaving many small herds to go extinct and trying to focus financial resources to save larger herds in larger blocks of habitat for future generations. The problem is the oil and gas industry in western Canada, and hence the battle between resources that are worth billions of dollars and a few caribou. Wolf control can serve as a short term solution, but it is expensive and temporary. Governments like action even if it is of no use in the long term; it makes good media coverage. None of these kinds of conservation decisions are scientific in nature, and must be policy decisions by governments. It flips us back into the continuum between options (1) and (2) in the opening paragraph above. And for governments policy decisions are more about jobs and money than about conservation.

The list of threatened and endangered species that make our newspapers are a tiny fraction of the diversity of species in any ecosystem. There is no question but that many of these charismatic species are declining in numbers, but the two larger questions are: will this particular species go extinct? And if this happens will this make any difference to ecosystem function? There is scarcely a single species of all that are listed as threatened and endangered for which ecologists have a good answer to either of these questions. So the fallback position to option (1) is that we have a moral obligation to protect all species. But this fallback position leads us even further out of science.

In the end we must ask as scientists what we can do with the understanding we have, and what more needs to be done to improve this understanding. Behind all this scientific research looms the elephant of climate change which we either ignore or build untestable computer models to make ‘predictions’ which may or may not occur, if only because of the time scales involved.

None of these problems prevents us from taking actions on conservation on the ground (Wiens 2016a). We know that, if we take away all the habitat, species abundances will decline and some will go extinct. Protecting habitat is the best course of action now because it needs little research to guide action. There is much to know yet about the scale of habitats that need preservation, and about how the present scale of climate change is affecting protected areas now. Short term research can be most useful for these issues. Long-term research needs to follow.

Bottrill, M.C., et al. (2009) Finite conservation funds mean triage is unavoidable. Trends in Ecology & Evolution, 24, 183-184. doi: 10.1016/j.tree.2008.11.007

Gerber, L.R. (2016) Conservation triage or injurious neglect in endangered species recovery. Proceedings of the National Academy of Sciences USA, 113, 3563-3566. doi: 10.1073/pnas.1525085113

Hebblewhite, M. (2017) Billion dollar boreal woodland caribou and the biodiversity impacts of the global oil and gas industry. Biological Conservation, 206, 102-111. doi: 10.1016/j.biocon.2016.12.014

Schneider, R.R., Hauer, G., Adamowicz, W.L. & Boutin, S. (2010) Triage for conserving populations of threatened species: The case of woodland caribou in Alberta. Biological Conservation, 143, 1603-1611. doi: 10.1016/j.biocon.2010.04.002

Wiens, J.A. (2016) Is conservation a zero-sum game? British Ecological Society Bulletin 47(4): 38-39.

Wiens, J.A. (2016a) Ecological Challenges and Conservation Conundrums: Essays and Reflections for a Changing World. John Wiley and Sons, Hoboken, New Jersey. 344 pp. ISBN: 9781118895108

On Mushrooms, Monitoring, and Prediction

Mushrooms probably run the world but we do not know this yet. My old friend Jim Trappe from Oregon State told me this long ago, and partly as a result of this interaction we began counting mushrooms at our boreal forest sites near Kluane, Yukon in 1993, long ago and even before the iPhone was invented. Being zoologists, we never perhaps appreciated mushrooms in the forest, but we began counting and measuring mushrooms appearing above ground on circular plots of 28m2. With the help of many students, we have counted about 12,000 plots over 24 years, even after being told by one Parks Canada staff member that they could not assist us because “real men do not count mushrooms”. At least we know our position in life.

At any rate the simple question we wanted to ask is whether we can predict mushroom crops one year ahead. We know that many species eat these mushrooms, from red squirrels (who dry mushrooms on spruce tree branches so they can be stored for later consumption), to moose (Alice Kenney has photographed them kneeling down to munch mushrooms), to caribou (Art Rodgers has videoed) to small rodents and insects, not to mention Yukon residents. We know from natural history observations that mushroom crops in the boreal forest are highly variable from year to year, ranging from 0.1 to 110 g/10m2 wet weight, for a CV of 138% (Krebs et al. 2008). The question is how best to predict what the crop will be next year.  Why do we want to know next year’s crop? Two reasons are that large crops provide food for many animals and thus affect overall ecosystem dynamics, and secondly that the essence of understanding in science is the ability to understand why changes occur and if possible to be able to predict them.

We assume it has to be driven by climate, so we can gather together climate data and it is here that the questions arise as to how to proceed. At one extreme we can gather annual temperatures and annual rainfall, and at the other extreme we can gather daily rainfall. We first make the assumption that it is only the weather during the summer from May to August that is relevant for our statistical model, so annual data are not useful. But then we are faced with a nearly infinite number of possible weather variables. We have chosen months as the relevant weather grouping and so we tally May temperature averages, May rainfall totals, growing degree days above 5°C, etc. for all the years involved. This leads us into a statistical nightmare of having far more independent variables than measurements of mushroom crops. If we have, for example, 15 possible measures of temperature and rainfall we can generate 32,768 models ignoring all the interactive models. There are several standard ways of dealing with this statistical dilemma, with stepwise regression being the old fashioned approach. But new methods and advice continue to appear (e.g. Elith et al. 2008, Ives 2015). The ability to compare different regression models with the AIC approach helps (Anderson 2008) as long as there is some biological basis to the models.

We adopted a natural history approach, given that many people believe that large mushroom crops are associated with above average rainfall. We are blessed in the Yukon with only one possible crop of mushrooms per year (at least for the present), so that also simplifies the kinds of models one might use. At any rate (as of 2016) the simplest regression model to predict mushroom biomass in a particular year turned out to involve only rainfall from May (early spring) of the previous year, with R2 = 0.55. But this success has just led us into more questions of why we cannot find a model that will explain the remaining 45% of the variance in annual crops. Should one just give up at this point and be happy that we can explain a large part of the annual variation, or should one press on doing more modelling and looking for other variables? Data dredging is more and more becoming an issue in the ecological literature, and in particular in ecological events likely to be at least partly associated with climate (Norman 2014).

Another ecological problem has been that we do not identify the species of mushrooms involved and deal only in biomass. It may be that species identification would help us to improve predictability. But there are perhaps 40 or more species of mushrooms in our part of the boreal forest, and so we now have to become mycologists. And then as Jim Trappe would tell me, all of this ignores the important questions of what is going on with these fungi underground, so we have only scratched the surface.

The next question is how long a predictive model based on weather will continue to hold in an area subject to rapid climate change. Climate change in the southern Yukon is relatively rapid but highly variable from year to year, and only continuing monitoring will keep us informed about how the physical measurements of temperature and rainfall translate into events in the biological world.

All of this is to say that counting and measuring mushrooms is enjoyable and keeps one connected to the real world. It is also a free type of good exercise, and part of citizen science. Continued monitoring is necessary to see how the boreal ecosystem responds to changing climate and to see if good years for mushroom crops become more frequent. And in good years, many kinds of mushrooms are good to eat if you can beat the squirrels to them.

Anderson, D.R. (2008) Model Based Inference in the Life Sciences: A Primer on Evidence. Springer, New York. ISBN: 978-0-387-74073-7

Elith, J., Leathwick, J.R. & Hastie, T. (2008) A working guide to boosted regression trees. Journal of Animal Ecology, 77, 802-813. doi: 10.1111/j.1365-2656.2008.01390.x

Ives, A.R. (2015) For testing the significance of regression coefficients, go ahead and log-transform count data. Methods in Ecology and Evolution, 6, 828-835. doi: 10.1111/2041-210X.12386

Krebs, C.J., Carrier, P., Boutin, S., Boonstra, R. & Hofer, E.J. (2008) Mushroom crops in relation to weather in the southwestern Yukon. Botany, 86, 1497-1502. doi: 10.1139/B08-094

Norman, G.G. (2014) Data dredging, salami-slicing, and other successful strategies to ensure rejection: twelve tips on how to not get your paper published. Advances in Health Sciences Education, 19, 1-5. doi: 10.1007/s10459-014-9494-8

Predator Free New Zealand

The New Zealand Government announced in July 2016 the adoption of Predator Free New Zealand 2050, a program for the control and eradication of introduced pests. It is setting up a new public-private partnership company by the beginning of 2017 to help fund regional large-scale predator eradication programs with the anticipated funding ratio of 1 government dollar to 2 private dollars. This is a bold new program grounded in the fundamental research of an excellent array of conservation biologists that have carried out the field research underpinning what needs to be done to protect native biodiversity in New Zealand.

Because of its isolation and the complete absence of endemic terrestrial vertebrate predators, New Zealand has become a basket case for the conservation of native species after the introduction of four species of rodents – Norway rat, black rat, house mouse, and Pacific rat (kiore) – as well as the possum (introduced for fur), the stoat (to “control rodents”) and the hedgehog (Goldson et al. 2015). The initial focus in this program will be on rats, stoats, and possums. Rat control on islands has already been a major success story for New Zealand scientists (Russell et al. 2016).

Four short-term goals have been set for 2025 for the Predator Free New Zealand project:

  • An additional 1 million hectares of land where pests have been supressed or removed through Predator Free New Zealand partnerships
  • Development of a scientific breakthrough capable of removing at least one small mammal predator from New Zealand entirely
  • Demonstration areas of more than 20,000 hectares that are predator free without the use of fences
  • Complete removal of all introduced predators from offshore island nature reserves

This is a striking vision, and it puts New Zealand at the forefront of global conservation efforts and goals. Everyone appreciates that it will not be easy. In particular there has to be careful attention to the order in which pests are removed. Competition between invasive species as well as predation among them often has counterintuitive results. In New Zealand when rats were removed from experimental plots, house mice increased, and when possums were removed rats increased (Ruscoe et al. 2011). When stoats (Mustela erminea) were removed, there was no effect on rat or mouse abundance, contrary to what a model predicted (Tompkins and Veltman 2006). At the moment there is no clear way to do a total removal of these pest mammals all at once rather than sequentially.

One of the major stimuli for this program has been stopping bovine TB transmission from possums to cattle. The brushtail possum (introduced from Australia) is a disease reservoir and vector of bovine tuberculosis to cattle. Extensive control programs for possums are applied over about 10 million ha in New Zealand by the spreading of 1080 poison baits and trapping, and this program has reduced possum populations to low numbers but not eliminated this pest (Byrom et al. 2016). Poisoning for possum control also reduces stoats and rats, and so has secondary benefits for native biodiversity. A total of approximately NZ$55 million is spent each year on this control program, and if possums could be eradicated, the financial benefits would be great for the cattle industry. Byrom et al. (2016) showed that possum reduction by poisoning had benefits not only for TB transmission but also for increases in vegetation (reduced herbivory), invertebrate, frog and bird abundance.

Two worries are that the social license to continue widespread use of deadly poisons will erode in the future and secondly that the pest species will eventually evolve resistance to the poisons. For these reasons much research is needed on more clever ways of achieving pest reduction and elimination.

The success of island eradications in the past 20 years has emboldened ecologists to wish for successes on larger and larger scales. But eradication is a complex problem and there is a long history of success and failures, particularly in insect populations (Myers et al. 2000). But by reaching out with a direct challenge to applied ecologists, molecular biologists, chemists, and other clever scientists, New Zealand has moved the standard forward in ways that bode well for understanding more why ecology matters.

And then it is on to the feral cats.

Byrom, A.E., Innes, J. & Binny, R.N. (2016) A review of biodiversity outcomes from possum-focused pest control in New Zealand. Wildlife Research, 43, 228-253. doi: 10.1071/WR15132

Campbell, K.J., et al. (2015) The next generation of rodent eradications: Innovative technologies and tools to improve species specificity and increase their feasibility on islands. Biological Conservation, 185, 47-58. doi: 10.1016/j.biocon.2014.10.016

Goldson, S.L., et al. (2015) New Zealand pest management: current and future challenges. Journal of the Royal Society of New Zealand, 45, 31-58. doi: 10.1080/03036758.2014.1000343

Myers, J.H., Simberloff, D., Kuris, A.M. & Carey, J.R. (2000) Eradication revisited: dealing with exotic species. Trends in Ecology and Evolution, 15, 316-320.

Ruscoe, W.A. et al. (2011) Unexpected consequences of control: competitive vs. predator release in a four-species assemblage of invasive mammals. Ecology Letters, 14, 1035-1042. doi: 10.1111/j.1461-0248.2011.01673.x

Russell, J.C. & Broome, K.G. (2016) Fifty years of rodent eradications in New Zealand: another decade of advances. New Zealand Journal of Ecology, 40, 197-204. doi: 10.20417/nzjecol.40.22.

Tompkins, D.M. & Veltman, C.J. (2006) Unexpected consequences of vertebrate pest control: predictions from a four-species community model. Ecological Applications, 16, 1050-1061. doi: 10.1890/1051-0761(2006)016[1050:UCOVPC]2.0.CO;2


Technology Can Lead Us Astray

Our iPhones teach us very subtly to have great faith in technology. This leads the public at large to think that technology will solve large issues like greenhouse gases and climate change. But for scientists we should remember that technology must be looked at very carefully when it tells us we have a shortcut to ecological measurement and understanding. For the past 35 years satellite data has been available to calculate an index of greening for vegetation from large landscapes. The available index is called NDVI, normalized difference vegetation index, and is calculated as a ratio of near infrared light to red light reflected from the vegetation being surveyed. I am suspicious that NDVI measurements tell ecologists anything that is useful for the understanding of vegetation dynamics and ecosystem stability. Probably this is because I am focused on local scale events and landscapes of hundreds of km2 and in particular what is happening in the forest understory. The key to one’s evaluation of these satellite technologies most certainly lies in the questions under investigation.

A whole array of different satellites have been used to measure NDVI and since the more recent satellites have different precision and slightly different physical characteristics, there is some problem of comparing results from different satellites in different years if one wishes to study long-term trends (Guay et al. 2014). It is assumed that NDVI measurements can be translated into aboveground net primary production and can be used to start to answer ecological questions about seasonal and annual changes in primary production and to address general issues about the impact of rising CO2 levels on ecosystems.

All inferences about changes in primary production on a broad scale hinge on the reliability of NDVI as an accurate measure of net primary production. Much has been written about the use of NDVI measures and the need for ground truthing. Community ecologists may be concerned about specific components of the vegetation rather than an overall green index, and the question arises whether NDVI measures in a forest community are able to capture changes in both the trees and the understory, or for that matter in the ground vegetation. For overall carbon capture estimates, a greenness index may be accurate enough, but if one wishes to determine whether deciduous trees are replacing evergreen trees, NDVI may not be very useful.

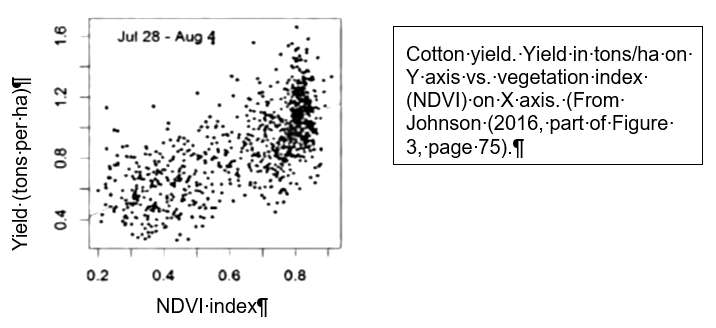
How can we best validate satellite based estimates of primary productivity? To do this on a landscape scale we need to have large areas with ground truthing. Field crops are one potential source of such data. Kang et al. (2016) used crops to quantify the relationship between remotely sensed leaf-area index and other satellite measures such as NDVI. The relationships are clear in a broad sense but highly variable in particular, so that the ability to predict crop yields from satellite data at local levels is subject to considerable error. Johnson (2016, Fig. 6, p. 75) found the same problem with crops such as barley and cotton (see sample data set below). So there is good news and bad news from these kinds of analyses. The good news is that we can have extensive global coverage of trends in vegetation parameters and crop production, but the bad news is that at the local level this information may not be helpful for studies that require high precision for example in local values of net primary production. Simply to assume that satellite measures are accurate measures of ecological variables like net aboveground primary production is too optimistic at present, and work continues on possible improvements.

Many of the critical questions about community changes associated with climate change cannot in my opinion be answered by remote sensing unless there is a much higher correlation of ground-based research that is concurrent with satellite imagery. We must look critically at the available data. Blanco et al. (2016) for example compared NDVI estimates from MODIS satellite data with primary production monitored on the ground in harvested plots in western Argentina. The regression between NDVI and estimated primary production had R2 values of 0.35 for the overall annual values and 0.54 for the data restricted to the peak of annual growth. Whether this is a satisfactory statistical association is up to plant ecologists to decide. I think it is not, and the substitution of p values for the utility of such relationships is poor ecology. Many more of these kind of studies need to be carried out.

The advent of using drones for very detailed spectral data on local study areas will open new opportunities to derive estimates of primary production. For the present I think we should be aware that NDVI and its associated measures of ‘greenness’ from satellites may not be a very reliable measure for local or landscape values of net primary production. Perhaps it is time to move back to the field and away from the computer to find out what is happening to global plant growth.

Blanco, L.J., Paruelo, J.M., Oesterheld, M., and Biurrun, F.N. 2016. Spatial and temporal patterns of herbaceous primary production in semi-arid shrublands: a remote sensing approach. Journal of Vegetation Science 27(4): 716-727. doi: 10.1111/jvs.12398.

Guay, K.C., Beck, P.S.A., Berner, L.T., Goetz, S.J., Baccini, A., and Buermann, W. 2014. Vegetation productivity patterns at high northern latitudes: a multi-sensor satellite data assessment. Global Change Biology 20(10): 3147-3158. doi: 10.1111/gcb.12647.

Johnson, D.M. 2016. A comprehensive assessment of the correlations between field crop yields and commonly used MODIS products. International Journal of Applied Earth Observation and Geoinformation 52(1): 65-81. doi: 10.1016/j.jag.2016.05.010.

Kang, Y., Ozdogan, M., Zipper, S.C., Roman, M.O., and Walker, J. 2016. How universal Is the relationship between remotely sensed vegetation Indices and crop leaf area Index? A global assessment. Remote Sensing 2016 8(7): 597 (591-529). doi: 10.3390/rs8070597.

Cotton yield vs NDVI Index