![]()
![]()
The human genome is thought to have about 100,000 genes, Drosophila about 10,000 genes, and even bacteria contain thousands of genes per cell!
Clearly, one-locus models of selection are highly simplified depictions of how populations evolve over time.
Exact analyses with multiple loci are, however, extremely difficult if not impossible to obtain.
Even with only two loci, the dynamics are complicated and not completely understood. Results are limited in scope, focusing on particular fitness schemes.
Nevertheless, results from two-locus models are very important in determining what properties of the one-locus model are unique and might not apply to the real-world situation in which a number of loci collectively interact to guide the formation of the individual.
Consider two loci, A and B, with two alleles each: A1, A2 and B1, B2, at frequencies pA1, pA2 and pB1, pB2.
There are four possible combinations of these alleles on a chromosome:
Chromosome type: A1 B1 A1 B2 A2 B1 A2 B2
Frequency: x1 x2 x3 x4
[Note: x1 + x2 + x3 + x4 = 1]
There are two important new concepts in the two-locus model: Recombination and linkage disequilibrium.
![]()
![]()
As you know from genetics, recombination occurs during meiosis in sexual organisms to generate gametes carrying new combinations of alleles:

We specify the rate of recombination between two loci by r.
[Note: Recombination may occur in any individual but it only changes the type of offspring produced if the parent was a double heterozygote.]
![]()
![]()
Linkage disequilibrium, on the other hand, measures whether an allele at one locus is associated (or correlated) with an allele at a second locus.
Linkage disequilibrium, D, is measured by x1 x4 - x2 x3.
Positive D implies that the chromosomes A1 B1 (x1) and A2 B2 (x4) are more common than expected.
Negative D implies that the chromosomes A1 B2 (x2) and A2 B1 (x3) are more common than expected.
In a randomly mating population, linkage disequilibrium measures the difference between observed and expected chromosome frequencies:
|D| = | OBS - EXP |
D = x1 - pA1 pB1
- D = x2 - pA1 pB2
- D = x3 - pA2 pB1
D = x4 - pA2 pB2
![]()
![]()
Recombination rate (r) is a measure of the distance between two loci and equals the probability that a gamete contains a chromosomal combination not found in the parents.
Linkage disequilibrium (D) is a measure of whether an allele at one locus tends to be found more often with an allele at another locus.

![]()
![]()

Among 15 diploid individuals (30 chromosomes):
Since D is positive, solid squares and solid circles are more likely to be found together on a chromosome than expected:
Frequency of solid squares = 17/30
Frequency of solid circles = 15/30
Expected frequency of solid square - solid circle chromosome = 17/30 * 15/30 = 0.28 (less than the observed 10/30).
(Similarly, hollow square - hollow circle chromosomes are more common than expected.)
![]()
![]()
If all individuals are equally fit (=no selection), chromosome frequencies change from one generation to the next according to:
X1' = X1 - r D
X2' = X2 + r D
X3' = X3 + r D
X4' = X4 - r D
In the absence of selection, pA1' can be shown to equal pA1[t]. (CHALLENGE: Try to show this.)
Point 1: In the absence of selection, allele frequencies remain constant.
Also notice that recombination only matters when there is linkage disequilibrium in the population. (Why?)
If D is positive, for example, recombination reduces the frequency of the two chromosomes that are more common than expected: A1 B1 and A2 B2.
In the absence of selection, D[t+1] = (1-r) D[t]. (CHALLENGE: Try to show this.)
Point 2: Linkage disequilibrium decays at a rate r every generation.
![]() After an amount of time t, the expected amount of disequilibrium is D[t]=(1-r)t D[0].
After an amount of time t, the expected amount of disequilibrium is D[t]=(1-r)t D[0].
Therefore, after enough time has passed, we expect to see little linkage disequilibrium between two neutral (= not selected) loci unless they are very tightly linked.
[NOTE: Unlike Hardy-Weinberg, however, linkage equilibrium (D=0) is not attained in one generation.]
![]()
![]()
Linkage disequilibrium was measured between several pairs of loci in Drosophila melanogaster.
The statistical evidence for a non-zero D value is here plotted as a function of distance between the pair of loci:
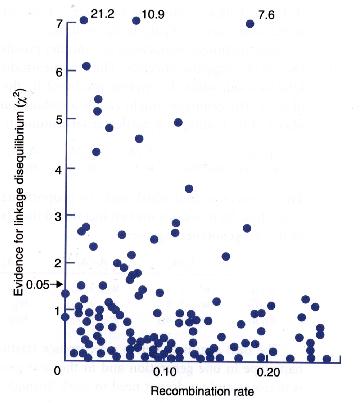
![]() Alleles at most pairs of loci are not significantly associated.
Alleles at most pairs of loci are not significantly associated.
![]()
![]()
Next we'll consider selection acting on two loci in the diploid phase of a life cycle:
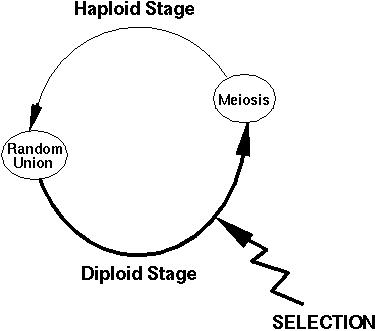
where the survival of a diploid individual depends on its two-locus genotype:
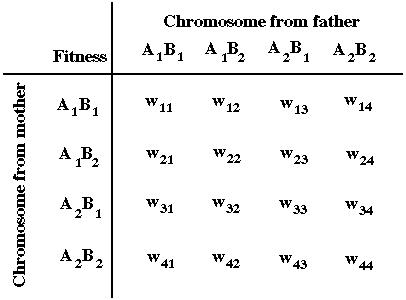
Assuming that fitness depends only on the alleles carried (regardless of whether they're on maternal or paternal chromosomes), the equations describing evolution in the two-locus diploid model are:
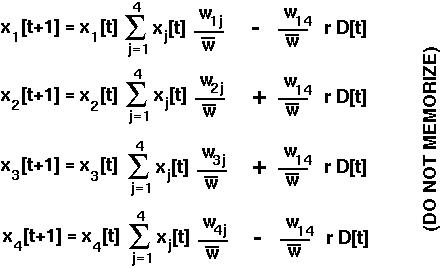
where

is the mean fitness of all members of the current population.
![]()
![]()
Surprisingly, even with only two loci, we do not understand the general behavior of the chromosome frequencies over time under selection.
Several important results have been determined, which we will highlight.
![]() GENETIC HITCHHIKING = Allele frequencies change at the neutral locus because of an association (D) with the selected locus.
GENETIC HITCHHIKING = Allele frequencies change at the neutral locus because of an association (D) with the selected locus.
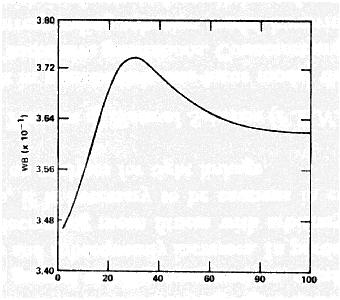
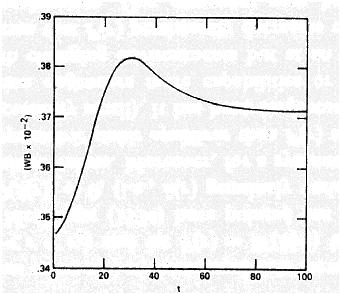
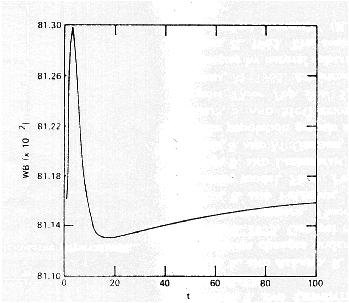
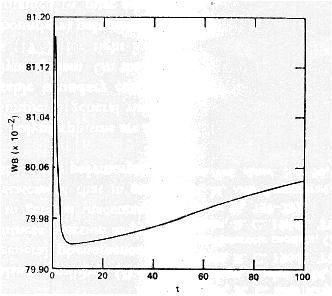
Mean fitness behavior in simulations of Karlin and Carmelli (1975):
IMPORTANT CONCEPTS TO REMEMBER:
SOURCES: