
One-Locus Diploid Selection Model
We turn now to a model describing selection among diploid organisms.
We assume that selection acts in a large population only in the diploid phase (not in the haploid phase), with random mating, no migration, and no mutation.

Let p[t] equal the frequency of the A allele among adult diploids.
Since fair meiosis does not alter allele frequencies and since there is no selection in the haploid phase, p[t] will also equal the frequency of the A allele among the haploid gametes of these adults.
With either random union of these gametes in a gamete pool or with random mating of individuals, the diploid offspring will be in the Hardy-Weinberg proportions:
p2[t] : 2 p[t] q[t] : q2[t]
We wish to determine the effects of selection on diploid individuals with the relative fitnesses:
Selection weights the frequency of each genotype by its relative fitness:
Dividing each of these by their sum gives the frequency of the three genotypes after selection.
Since the frequency of A equals the frequency of AA individuals plus half the frequency of Aa individuals, the frequency of the A allele among adult diploids in the next generation (t+1) equals:
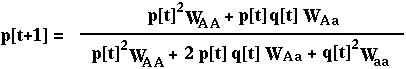
(The denominator is the mean relative fitness,  [t], with diploid selection.)
This equation describes the change in allele frequency among diploid adults from one generation to the next.
We will not fully analyse this equation, but we will show how selection in the diploid phase works graphically and discuss some important results.
(Which forms of selection were present in the haploid selection model?)
The effects of selection on a diploid population depend strongly on which form of selection is operating.


These plots show directional selection favoring the A allele for different strengths of selection.
Notice that as the fitnesses become more similar, it takes longer for A to rise from low frequency to high frequency.
ROUGHLY, as the fitness differences decrease by a factor of x, the time it takes for A to spread increases by a factor of x.
Fitnesses in the diploid model with directional selection are often defined relative to one homozygote as:
In this case, h describes the dominance of the A allele:
If WAA < WAa < Waa, directional selection favors the a allele:

The frequency of A behaves quite differently when the heterozygote has the highest fitness:
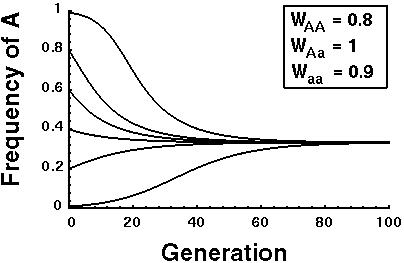
Regardless of the starting frequency of A, the system approaches an intermediate frequency of A, where it remains forevermore.
This value is called a polymorphic equilibrium.
The exact value of the polymorphic equilibrium depends on the fitnesses.
[NOTE: The population never splits in two.]
When the heterozygote has the lowest fitness, the A allele rises in frequency if it is common or decreases in frequency if it is rare:

The cut-off between where A rises or drops is called an unstable polymorphic equilibrium.
The exact value of this cut-off depends on the fitnesses.
An equilibrium is a value of the allele frequency where the allele frequency remains constant over time, i.e., where p[t+1]=p[t].
The equilibria for the diploid model can be found by solving:

Doing the algebra, p remains constant in frequency only if p=0, p=1, or
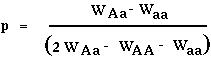
This last equilibrium only falls between 0 and 1 when
OR
WAA > WAa < Waa
With directional selection, there is no polymorphic equilibrium (no value where p[t+1]=p[t] between 0 and 1).
The frequency of A will approach the polymorphic equilibrium in the first case (heterozygote advantage), but will be repelled from it in the second case (heterozygote disadvantage).
What is the value of the polymorphic equilibrium in the graphs shown above?
Example: Sickle Cell Anemia
Sickle-cell anemia is a human disease affecting the shape and flexibility of red blood cells.
It is caused by a single mutation in the sixth amino acid of the  chain of hemoglobin.
The mutant form of hemoglobin (S) tends to crystalize and form chains, causing distortions in red blood cells:
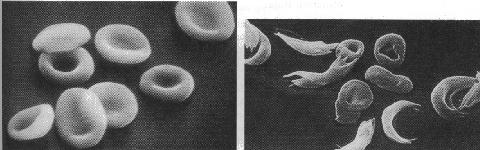
Homozygous carriers of S experience the greatest degree of sickling and tend to suffer severe anemic attacks.
Heterozygous carriers of S also suffer from sickling of red blood cells, but to a lesser degree.
However, heterozygous carriers are less likely to die from malaria, since red blood cells infected with the parasites causing malaria tend to sickle and be destroyed.
The fitnesses of each genotype can be estimated from the extent to which genotypic frequencies among adults depart from Hardy-Weinberg.
For the Nigerian population studied:
The frequency of the non-mutant allele (A) in this population was 0.877, which matches extremely well!
Example: Decline of a recessive lethal allele
Dawson (1970) studied the decline of a recessive lethal mutation (Waa = 0) in a population of flour beetles.
He started a laboratory population of beetles with an initial frequency of the mutation of 1/2.
The frequency of a was measured and observed to decrease over time:
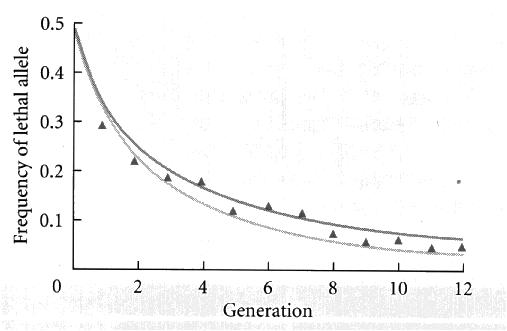
The triangles are the observations, the top line shows the expected decline in a assuming that WAa = 1, and the bottom line shows the expected decline in a assuming that WAa = 0.9.
The data match the expected decline for a recessive (or nearly recessive) lethal allele.
Diploid Model
SOURCES:
 Back to Biology 336 home page.