
The Evolution of Biological Diversity
All living organisms are descended from an ancestor that arose between 3 and 4 billion years ago.
Currently, the diversity of life on earth includes some 5 million to 50 million species!
Before discussing the observed patterns, it is worth thinking about the possible ways in which the number of species present at any point in time may have changed over the history of the earth:

The patterns and rates of diversification reflect the rates of speciation (S) and extinction (E) of taxa.
At the simplest conceptual level, the number of species (N) present on earth will change over time according to the formula:
 N = (S - E) N t,
where N is the change in number of species over an amount of time t and where S and E are rates of speciation and extinction per species.
If S and E remain approximately constant over time, exponential growth will result.
Both speciation and extinction rates may vary over time and from species to species depending on:
Diversity-dependent growth: An alternative possibility is that either the rate of speciation or extinction (or both) depends on diversity levels (N).
Why might this be true?
If (S - E) goes down as N increases, then logistic growth in the number of species is expected, potentially resulting in a global equilibrium.
The number of species is difficult to determine from the fossil record.
Consequently, paleontologists tend to study diversity by counting the number of higher taxa (e.g. families).
Two major databases have been compiled:
The pattern of diversification depends on the taxa examined.
For several groups, an exponential rise in the number of families best fits the data.
(1) All of the families in the Fossil Record 2 database:

(2) Tetrapod families:

(3) Insect families:

(REMEMBER: Extinctions are happening throughout.)
For other groups, the patterns are more complicated.
For example, the growth of marine families appears to show a number of steps:

Sepkoski interpreted this as the result of the radiation of three distinct "evolutionary faunas":
Why might marine fauna have increased rapidly and then reached a plateau between 400 and 250 MYA, whereas tetrapods and insects have not plateaued?
Similarly, the number of families of vascular land plants appears to have increased in steps:

Knoll and colleagues (1984, 1985) interpreted this as the appearance and radiation of new major baupläne (= body forms):
The subsequent rise of angiosperms has proceeded exponentially.
Surprisingly, these data suggest that the number of species on earth has not reached a global equilibrium.
If anything, the most prevalent pattern is of exponential growth.
Can exponential growth of species be sustained? How?

That is, exponential growth of species may occur by changing patterns of "species packing", with generalists being replaced by more specialized forms and with an increase in the complexity of the ecological community.
Are the rates of speciation and extinction the same for different organisms?

No!
Interestingly, those taxa with high rates of increase (S-E) tend also to have high extinction rates.
What might explain this odd result?
(1) Ecological Opportunity:
Living organisms present numerous examples of spectacular radiations following the colonization of isolated islands or bodies of water, e.g.:
|

|
In these cases, the fauna was locally depauperate before the arrival of the original colonist.
 "Vacant niches" existed into which the newly arrived organisms diversified.
Similarly, there are several examples in the fossil record where the decreased representation of one group is followed or accompanied by a proliferation of another group.
The new group may cause the extinction of the former group (displacement)
The new group may be released from competition by the extinction of the former group (incumbent replacement)
For example, rodent-like, non-placental mammals (multituberculates) decreased in diversity in North America following the appearance of placental rodents.

The correlated pattern of increase and decrease suggests displacement or incumbent replacement?
Lineages often are seen to radiate following the mass extinction of another group.
For example, mammals radiated in the Tertiary period following the mass extinction of dinosaurs near the K-T boundary (the Cretaceous-Tertiary boundary ~65MYA).
Does this suggest displacement or incumbent replacement?
(2) Key Adaptations:
Speciation rates within a group may rise after the evolution of a new adaptive trait.
How can we tell whether a trait increases speciation rates?
For example, Ehrlich and Raven (1964) suggested that defenses against herbivores (e.g. latex and resin canals) promoted diversification in plants.
Mitter, Farrel and colleagues (1988,1991) tested this hypothesis by identifying 16 sister groups of plants with and without these canals.
In 13/16 cases, the canal-bearing groups contained more species than their sister clades.

Similarly, the fossil record suggests that key adaptations in marine organisms (specialization, predation, swimming, hard shells) promoted their diversification.
Key adaptations allow organisms to evolve into a greater variety of niches, creating a more complex and tiered community structure.
(3) Provinciality:
Speciation rates will depend on the extent to which organisms are distributed through space.
There has been a general trend over the last 250MY from wide-spread distributions to more localized distributions.
As Pangaea began to break apart during the Triassic, land and ocean masses became more spatially separated.
Ocean currents also changed, leading to a more pronounced temperature gradient.
These changes have increased the number of biological "provinces" (= a self-contained region wherein speciation rather than colonization dominates the appearance of new taxa).
An example (in reverse) is the extinction caused when the separate land provinces of North and South America became connected by the Isthmus of Panama (~2MYA).
23 families of mammals were endemic to South America (incl. sloths, armadillos, opossums, raccoons), 25 to North America (incl. mammoths, mastodons, saber-toothed cats, and camels), and 2 occurred in both.
| The "Great American Interchange" describes the resulting migration of animals across the Isthmus of Panama. |

|
Diversity, supported by provinciality, was lost following the Interchange: only 38/50 families remained, 24% went extinct.
The vast majority of species that have ever lived have gone extinct.
|
Extinction rates vary over time, but are dominated by the "big five" mass extinction events.
[Note: Peak in Cambrian probably reflects low diversity at that time.] |

|
| Extinction Event | MYA | Family Loss | Species Loss |
| End-Cretaceous | 65 | ~14% | ~76% |
| End-Triassic | 208 | ~30% | ~80% |
| End-Permian ** | 245 | ~60% | ~95% |
| Late Devonian | 367 | ~30% | ~83% |
| End-Ordovician | 439 | ~23% | ~85% |
[Family extinctions reflect all organisms in the Fossil Record 2 database. Species extinctions reflect loss of marine species estimated by Jablonski (1991,1995).]
Climate change has been cited as a major factor involved in each mass extinction event.
The largest of the extinction events, at the end of the Permian, is associated with a number of catastrophic climate changes (the "world-went-to-hell" hypothesis) including:
Major climate changes also surround the end-Cretaceous extinction (K-T), possibly resulting from a massive asteroid hitting the earth.
(A buried crater has been detected in the Yucatan peninsula of Mexico with a diameter of 180 km!)
These mass extinctions have played a major role in shaping the biota we see today.
Regardless of how adapted a species may be in "normal" times, if it succumbs to extinction during a massive climate change, it will play no further role in evolution.
For instance, at the K-T boundary, insects, amphibians, crocodilians, mammals, and turtles suffered few extinctions, whereas several bird species, ammonites, dinosaurs, and other large reptiles went extinct.
Although we generally do not know why extinction events are so selective, some patterns have emerged.
Jablonski (1986) found that bivalves and gastropods with wider geographic distributions were less likely to go extinct at the end of the Cretaceous.

Without these mass extinctions, the world would be a very different place.
For one thing, the rise and diversification of mammals may never have happened.
The "big five" mass extinction events decimated a large fraction of the organisms alive at the time.
Yet many of these extinctions occurred randomly.
Besides being wide-spread, there is no clear attribute that protected a group of organisms from extinction.
Stephen J. Gould (1989) in his book, Wonderful Life: The Burgess Shale and the Nature of History, argues that chance has played a defining role in evolution.
He asks us to re-run the tape of life and imagine possible alternative worlds:
The sun is about halfway through its expected existence.
"Run the tape again, and the first step from prokaryotic to eukaryotic cell might take twelve billion instead of two billion years - and stromatolites, never awarded the time needed to move on, might be the highest mute witnesses to Armageddon."
A large number of unusual, high-level taxa evolved during the Cambrian, most of which went extinct. Run the tape again, and primitive chordates bite the dust and some other oddball creature sneaks through.
Would dinosaurs have gone extinct?
"Mammals spent their first hundred million years - two-thirds of their total history -- as small creatures living in the nooks and crannies of a dinosaur's world."
If the dinousaurs had not gone extinct, would mammals have proliferated?
"The divine tape player holds a million scenarios, each perfectly sensible. Little quirks at the outset, occurring for no particular reason, unleash cascades of consequences that make a particular future seem inevitable in retrospect... The end results are so different, the initial perturbations so apparently trivial."
Yet has all of evolution been a quirky twist of fate?
I don't know.
If we played the tape of life again, we certainly would not arrive at the same place today.
But perhaps some striking similarities would appear.
I offer the following tantalizing examples.
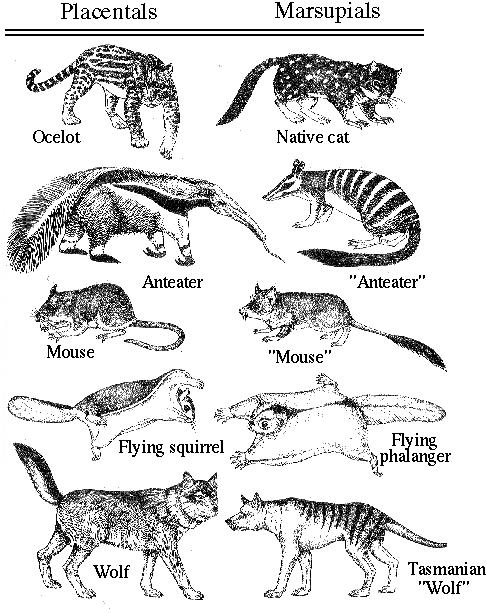
Example: Mammalian evolution among marsupials and placentals.
Example: Convergent evolution in Anolis lizards.
Lizards on different islands of the West Indies have evolved into similar ecological niches.
Despite the fact that lizards on the same island are most closely related, trunk-ground anoles on Jamaica are more similar in appearance, habitat, and behavior to trunk-ground anoles on Hispaniola (J. Losos).


Similarly, twig anoles on Jamaica are more similar to twig anoles on Hispaniola.


SOURCES OF INFORMATION AND FIGURES:
 Back to Biology 336 home page.